
By Paul R Salmon FCILT FSCM FCMI
In an era where supply chains are under intense scrutiny for their environmental footprint, packaging has become a prime target for innovation. Businesses around the world are pledging to cut down on unnecessary plastics, reduce transport emissions, and eliminate waste. Yet one hidden source of inefficiency and emissions lurks quietly in the background: product returns caused by damage in transit.
What if the very data from these damaged returns could be used to design leaner, smarter, and more sustainable packaging?
This article explores how analysing damage return rates can drive packaging optimisation, leading to lighter shipments, smaller footprints, reduced emissions, and ultimately, a more resilient and sustainable supply chain.
🧱 The Overlooked Link Between Damage, Packaging, and Sustainability
In most organisations, damaged returns are treated as a quality or customer service issue. The focus is often reactive: replacing the product, placating the customer, and investigating what went wrong in that particular shipment. Rarely is the data on damaged returns leveraged strategically to redesign packaging and logistics for long-term benefits.
This is a missed opportunity.
Every time a product is returned because of damage:
The packaging has failed in its core purpose – to protect. Additional packaging and transport resources are consumed in the return journey. The damaged product may need to be scrapped, repaired, or repackaged – each carrying an environmental cost.
But paradoxically, low levels of damage can also indicate over-engineered packaging. Companies frequently use multiple layers of cardboard, plastic fillers, or even wooden crates to “play it safe”. This over-packaging contributes to:
Excess weight per shipment. Wasted warehouse space and poor cube utilisation. Higher material costs and environmental impact from production to disposal.
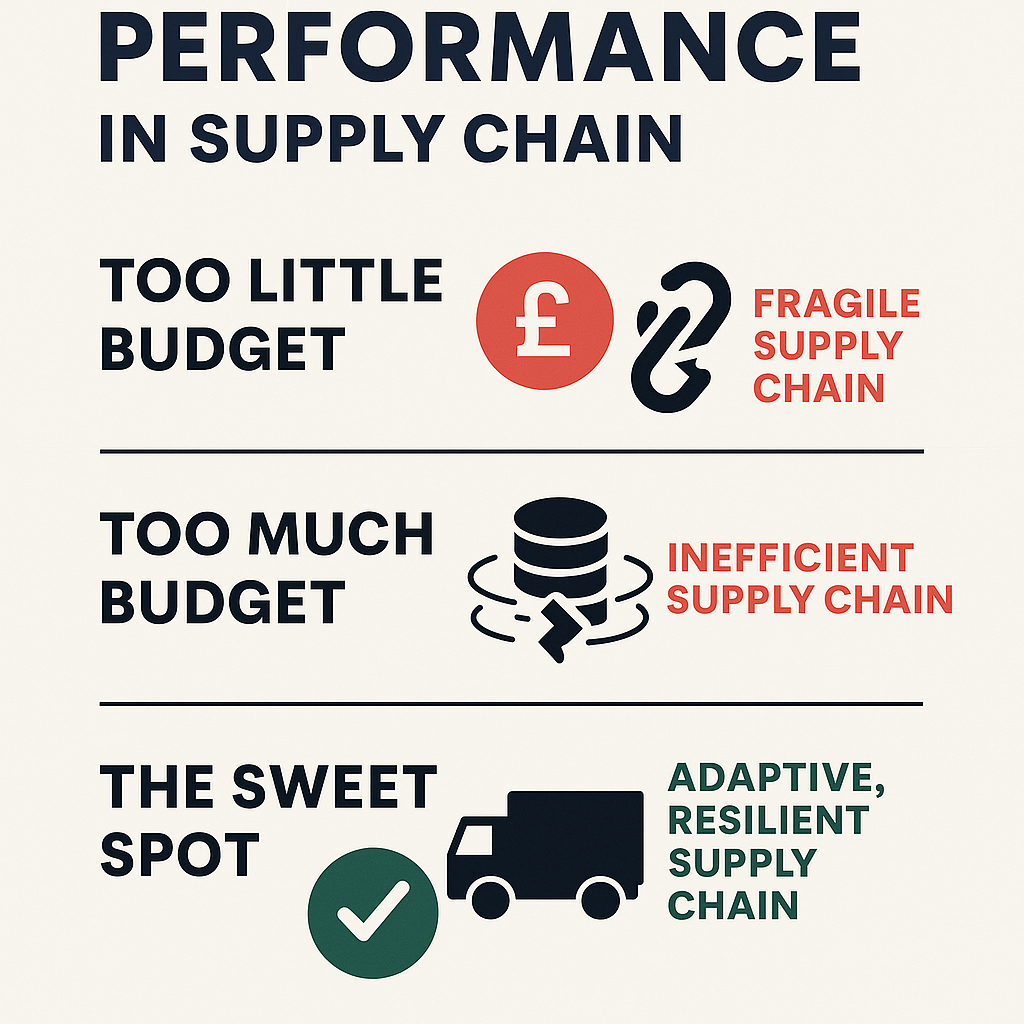
The challenge, then, is to strike the right balance: robust enough to protect, but lean enough to minimise weight, volume, and waste.
📊 Turning Damage Data Into Actionable Insight
1️⃣ Track and Analyse Damage Returns
Begin by creating a baseline. Analyse:
Damage rate: percentage of units returned due to damage. Common failure modes: crushed boxes, moisture ingress, vibration damage, poor stacking integrity. Transit profiles: are damages higher on specific routes, transport modes, or last-mile deliveries?
This data gives you the first clues as to whether your packaging is too weak, just right, or unnecessarily heavy-duty.
2️⃣ Diagnose Packaging Performance
Low damage rates are often seen as a success. But ask:
Could you remove or redesign elements without increasing risk? Are there “air gaps” in packaging that waste space? Could smarter structural design (e.g., honeycomb inserts, moulded pulp) achieve the same protection at lower weight?
Conversely, if damage rates are high, consider whether:
Materials are failing under load or moisture. Handling practices are incompatible with current designs. Packaging fails under real-world conditions (vibration, impact) not simulated in lab tests.
🌱 The Sustainability and Efficiency Payoff
Reducing packaging is not just about aesthetics or compliance with plastic bans. Done correctly, it creates a virtuous cycle:


Leave a Reply